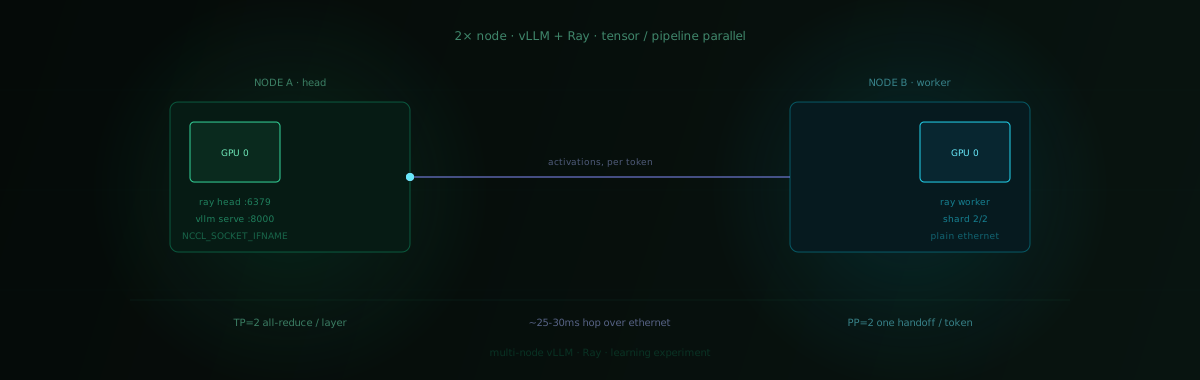
After the 4090 quantization post I got curious about the other way of scaling a model - not trying to fit it into one GPU, but spreading it across several boxes. Especially, it’s relevant for huge models which can’t phisycally fit even within single node with 8 GPUs or so. I had two separate machines with one GPU each, so I set up a small multi-node vLLM cluster just to see how it behaves. Nothing production-grade, just a small learning exercise to build intuition for tensor parallelism vs pipeline parallelism when the “interconnect” is regular ethernet instead of NVLink or InfiniBand. You can rent a bigger machine (with Blackwell) with advanced networking, but it was a bit much for this.
The setup
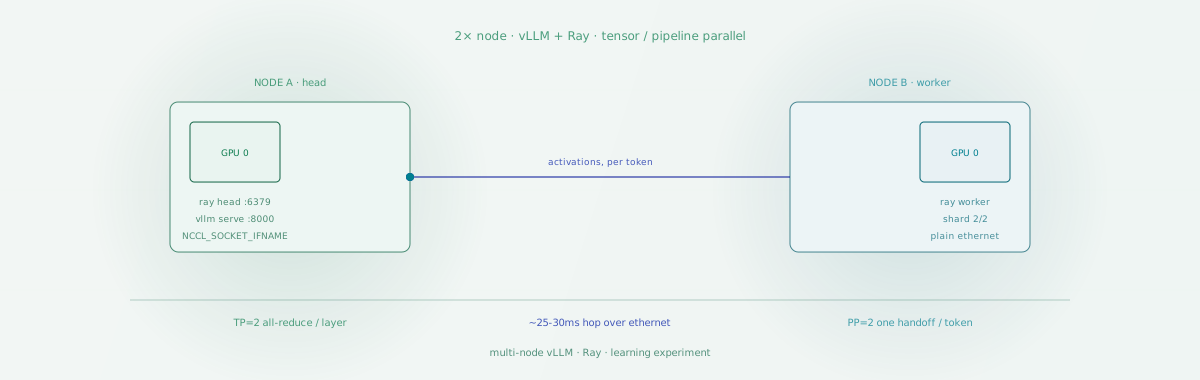
Two boxes, one GPU each, connected over a normal network - no fancy fabric. Ray ties them together into one cluster, and vLLM’s distributed executor uses that cluster to shard a model across both GPUs. I used Qwen3.5-27B-FP8 which can perfectly fit even within one 48GB VRAM GPU (e.g L40S in AWS, but I wanted to learn multi-node setup so kept it easy).
# same image on both boxes
cat > Dockerfile.ray <<'EOF'
FROM vllm/vllm-openai:v0.21.0
RUN pip install --no-cache-dir "ray[default]"
EOF
docker build -f Dockerfile.ray -t vllm-ray:v0.21.0 .

# node A (head, it also behaves as a worker in Ray)
bash run_cluster.sh vllm-ray:v0.21.0 $HEAD_IP --head ~/.cache/huggingface \
  -e VLLM_HOST_IP=$HEAD_IP -e NCCL_SOCKET_IFNAME=$NIC -e GLOO_SOCKET_IFNAME=$NIC

# node B (worker)
bash run_cluster.sh vllm-ray:v0.21.0 $HEAD_IP --worker ~/.cache/huggingface \
  -e VLLM_HOST_IP=$WORKER_IP -e NCCL_SOCKET_IFNAME=$NIC -e GLOO_SOCKET_IFNAME=$NIC
docker exec -it node ray status on a head node should report two nodes and two GPUs once both containers are up. If it only sees one, it’s almost always a security group / firewall issue - Ray needs 6379 and 8265 open between the boxes plus the NCCL ephemeral port range.
Both boxes also need the full model weights locally beforehand (each node only loads its own shard onto the GPU, but it still reads from the full checkpoint on disk):
# on both machines
docker exec -it node hf download Qwen/Qwen3.5-27B-FP8
Tensor parallel first
With --tensor-parallel-size 2, vLLM splits every layer’s weight matrices across both GPUs and all-reduces the activations after each one:
docker exec -d node bash -lc \
  'vllm serve Qwen/Qwen3.5-27B-FP8 \
     --distributed-executor-backend ray \
     --tensor-parallel-size 2 \
     --max-model-len 16384 \
     --enforce-eager --port 8000'
It came up fine, nvidia-smi on both boxes showed the model actually sharded (~14GB resident on each), and requests worked. But once I started benchmarking, throughput was rough - single-digit requests per minute at any real concurrency. That makes sense: TP does an all-reduce after every layer, dozens of times per forward pass, and each one is a round trip over the network. Fine on NVLink where that round trip is nanoseconds, really bad on a regular NIC.
Pipeline parallel instead
Pipeline parallelism only crosses the network once per token instead of once per layer - node A runs the first half of the layers, hands the activations to node B, which runs the rest:
docker exec -d node bash -lc \
  'vllm serve Qwen/Qwen3.5-27B-FP8 \
     --distributed-executor-backend ray \
     --pipeline-parallel-size 2 --tensor-parallel-size 1 \
     --max-model-len 16384 --enforce-eager --port 8000'
Better, but still not great. I tried the usual fixes - dropping --enforce-eager to get CUDA graphs back, cutting --max-model-len to free up more KV cache, chunked prefill, more concurrent sequences. None of it moved the needle much:
requests:        30  (ok=30, failed=0)
throughput:      5 RPM
latency  p95:    136.55s
decode tput:     33 output tok/s (aggregate)
Turns out that’s the actual floor for this setup, not something you can tune away. In PP, every single decoded token has to cross the wire once - stage 0 computes its half, ships the activations to stage 1 over TCP, stage 1 finishes and sends the token back. My interconnect added roughly 25-30ms per hop, so ~33 tok/s was basically a hard ceiling set by network latency, independent of batching or CUDA graphs. Removing --enforce-eager barely changed anything - it cuts kernel launch overhead, not network round trips.
The boring answer wins
The thing that actually got good throughput was giving up on splitting the model at all. I switched to a smaller model (Qwen3-8B-FP8) and ran one independent vLLM instance per box, no Ray, no distributed backend, just plain single-GPU serving on each:
docker run -d --gpus all --network host \
  -e HF_TOKEN=$HF_TOKEN --name vllm-8b vllm/vllm-openai:v0.21.0 \
  --model Qwen/Qwen3-8B-FP8 --max-model-len 8192 \
  --max-num-seqs 128 --gpu-memory-utilization 0.90 --port 8000
Then a small client round-robins requests across both endpoints (a call_model.py script, roughly 100 lines with ThreadPoolExecutor and percentile math). Paced at a realistic 125 RPM which I had in mind as a benchmark number:
requests:        250  (ok=250, failed=0)
throughput:      117 RPM achieved, offered 125.0
latency  p95:    11.23s
decode tput:     353 output tok/s (aggregate)
Ten times the aggregate decode throughput of the cross-node 27B setup, with a model that’s still perfectly usable for a lot of low-thinking tasks. Two independent replicas behind a load balancer beat one model artificially glued across a slow network - which is obvious in retrospect, but it’s a different thing to feel it in actual numbers than to just know it abstractly.
Watching it happen
I also wired up Prometheus + Grafana + a DCGM exporter on each box, scraping vLLM’s own /metrics (only exposed on the head, since that’s the API server aggregating the whole TP group) plus GPU utilization from both nodes using . The useful bit was watching GPU util sit low while the NIC maxed out during the MoE experiment I tried afterward - a nice visual confirmation that the bottleneck really was the network and not the GPUs sitting idle for no reason.