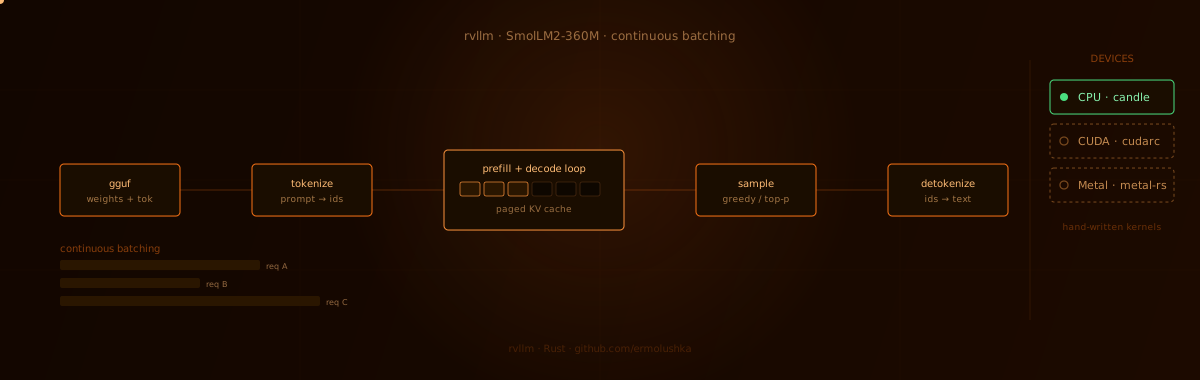
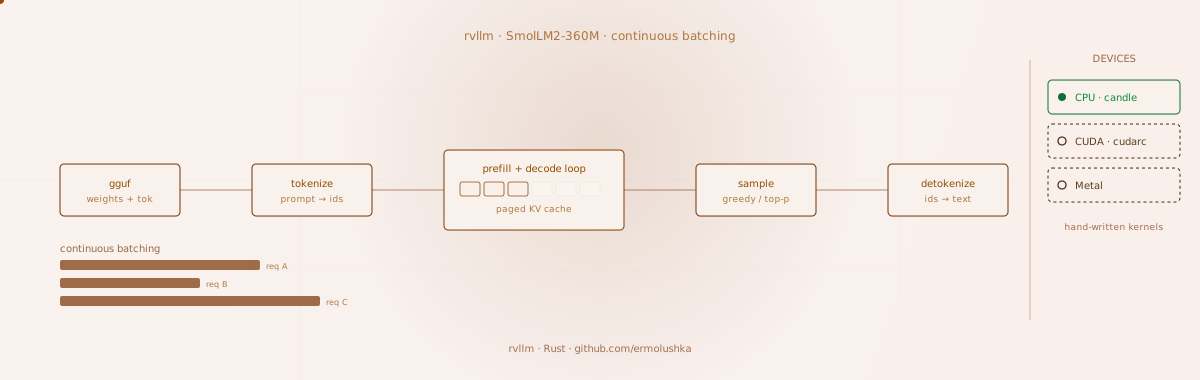
In the last post I added a CUDA backend to rvllm, my small LLM inference engine, and ended with “Metal next”. My laptop is a MacBook with an M5, which has a perfectly good GPU that CUDA can’t use, so this is the post where it finally gets used. Run rvllm with --metal and the whole forward pass of SmolLM2-360M runs on the Apple GPU. I did not use Candle’s Metal backend and I did not use Apple’s ready made matmul library (MPS). Everything, matrix multiplication included, is implemented without it.
I wrote this one for people who have never touched a GPU API. If you already know CUDA, skip to Numbers or to The matmul pain story, which is the part I enjoyed the most.
Why a GPU at all
A CPU has a few cores (my M5 has 10), and each one is very good at doing one complicated thing at a time. A GPU has thousands of tiny simple execution lanes that all do the same small thing on different data at the same time. Running an LLM is mostly multiplying huge matrices, which fits here well: the same multiply and add repeated millions of times.
The unit of work on a GPU is called a kernel. A kernel is a small function that you write once, and the GPU runs it on thousands of threads at the same time. Each thread gets its own index so it knows which piece of data is its own. Adding two arrays on a CPU is a loop. On a GPU it is a function with no loop, where thread number i adds element i:
kernel void add(
    device const float *a [[buffer(0)]],
    device const float *b [[buffer(1)]],
    device float *out [[buffer(2)]],
    constant uint &n [[buffer(3)]],
    uint i [[thread_position_in_grid]]
) {
    if (i < n) out[i] = a[i] + b[i];
}
That is a real kernel from rvllm, and it is written in MSL, the Metal Shading Language, which is C++ with a few extra keywords. The weird [[buffer(0)]] markers say which argument slot each parameter comes from, and [[thread_position_in_grid]] says “give me my own thread number”. The if (i < n) is there because the GPU launches threads in groups, so sometimes a few more threads than elements get launched.
What Metal is
Metal is Apple’s API for talking to the GPU. It plays the same role as CUDA does on NVIDIA. If you know one, the other is mostly a translation exercise, and I wrote the Metal backend as a line by line mirror of the CUDA one (src/metal/ next to src/cuda/). Here is the dictionary:
CUDA                         Metal
cuda context                 MTLDevice
stream                       MTLCommandQueue + MTLCommandBuffer
kernel launch                encode into a MTLComputeCommandEncoder
CudaSlice<T> (device buffer) MTLBuffer
thread block                 threadgroup
warp (32 threads)            simdgroup (32 threads on Apple GPUs)
shared memory                threadgroup memory
NVRTC                        newLibraryWithSource (compile MSL at runtime)
Three things in Metal are different enough from CUDA that they shaped the code, so let me go through them.
1. Memory is shared
On a PC, the GPU has its own memory (VRAM) and the CPU has its own, and you copy data across a slow bus. Half of CUDA programming is cudaMemcpy. An Apple chip has one pool of memory that the CPU and the GPU both use. So when I create a Metal buffer, the CPU can write into it directly and the GPU can read it, with no copy at all:
let buf = device.new_buffer(bytes, MTLResourceOptions::StorageModeShared);
// buf.contents() is a plain pointer the CPU can read and write
In the CUDA backend, getting the logits back to the CPU for sampling is a device to host copy. In the Metal backend it’s a read from memory the CPU can already see. The one rule is that you must not look at a buffer while the GPU is still writing it, so you wait for the GPU first.
2. You record work, then you submit it
In CUDA, launching a kernel looks like a function call, and it starts running (almost) right away. In Metal you do something different. You create a command buffer, which is a list of work. You open a command encoder on it, and every kernel “launch” just appends one entry to that list: which kernel, which buffers, how many threads. Nothing runs yet. When the list is complete you commit() it, and the GPU runs the whole thing in order.
enc.set_compute_pipeline_state(pso);          // which kernel
enc.set_buffer(0, Some(&a), 0);               // argument slots
enc.set_buffer(1, Some(&b), 0);
enc.set_bytes(3, 4, &n as *const u32 as _);   // small values are copied in directly
enc.dispatch_threads(grid, threads_per_group);// append "run it on this many threads"
// ... hundreds more dispatches ...
enc.end_encoding();
cmd.commit();
cmd.wait_until_completed();
In rvllm one forward pass is one command buffer. A step of SmolLM2 is about 900 dispatches, and the CPU needs only around 0.4 ms to record them all. Then it commits once and waits for the GPU.
3. Compile the kernels at runtime
In CUDA I used NVRTC, so there was no nvcc to install. Metal has the same thing: you hand the MSL source text to the driver and get a library back.
let options = CompileOptions::new();
options.set_fast_math_enabled(false);
let library = device.new_library_with_source(&source, &options)?;
let function = library.get_function("rmsnorm", None)?;
let pso = device.new_compute_pipeline_state_with_function(&function)?;
The kernels live in five .metal files, which get embedded into the binary with include_str! and compiled when the runtime starts. That is 24 kernels in about 700 lines. I had no Xcode metal compiler installed on this machine (xcrun metal says “unable to find utility”), and it turns out you don’t need one.
How a GPU runs your kernel
One more bit of vocabulary, because the matmul section needs it. When you launch a kernel you say how many threads you want, and the GPU splits them into threadgroups. Threads inside one threadgroup can share a small, fast scratch memory (threadgroup memory) and can wait for each other with a barrier. Threads in different threadgroups can’t talk during the kernel.
Inside a threadgroup, threads run in lockstep bundles of 32 called simdgroups (warps in CUDA). The 32 threads of a simdgroup run the same instruction together, and Metal gives you instructions that let them exchange values directly in registers, like simd_sum(x), which adds up x across all 32 lanes. That is much faster than going through memory.
Here is how rvllm’s RMSNorm uses that. It needs the sum of squares of a row of 960 numbers. One threadgroup of 256 threads takes one row. Each thread sums a strided slice, then a small helper adds everything up in two steps:
inline float tg_sum(float v, threadgroup float *scratch, uint sg, uint lane, uint n_sg) {
    v = simd_sum(v);                       // 32 lanes -> 1 number, no memory involved
    if (lane == 0) scratch[sg] = v;        // one number per simdgroup (8 of them)
    threadgroup_barrier(mem_flags::mem_threadgroup);
    float total = 0.0f;
    for (uint i = 0; i < n_sg; ++i) total += scratch[i];
    threadgroup_barrier(mem_flags::mem_threadgroup);
    return total;
}
My CUDA version of this did the textbook thing: a loop in shared memory that halves the number of active threads each round, with a barrier each round. The Metal version needs two barriers in total. I didn’t set out to make it better than CUDA, the SIMD instruction is just the natural way to write it on Apple hardware. (My CUDA code doesn’t use warp shuffles, and that’s in its “what’s basic” list from last time.)
What the kernels do
Most of the 24 kernels are ports of the CUDA ones, and many are one thread per output element with some index math. The model is a Llama style transformer, so per layer the work is:
- RMSNorm the input (one threadgroup per row).
- Project into Q, K and V (matmuls, more on them below).
- RoPE rotates Q and K by their position, one thread per pair of numbers.
- Write the new K and V into the paged KV cache (
kv_write), then gather each sequence’s whole cached K and V back out into a contiguous buffer (kv_gather). The cache is the paged kind from kv-cache-scheduler, so a sequence’s tokens live in scattered blocks and this is the integer division and modulo that finds them. - Attention: scores
Q @ K^T, add the mask, softmax, thenprobs @ V. - Output projection, add the residual, RMSNorm again, then the feed forward (gate and up projections,
silu(gate) * up, down projection), add the residual.
After the last layer there is a final norm and the output projection to the vocabulary, and for greedy decoding a GPU argmax so that only one integer per sequence comes back instead of 49152 floats.
Everything the CUDA backend supports works here too: Llama 3 RoPE scaling, Qwen2 attention biases, Qwen3 Q/K norm, Gemma’s sliding window attention and GELU, and LFM2’s short convolutions with their per sequence state.
The matmul pain story
In the CUDA post I handed matrix multiplication to cuBLAS. For Metal I wanted to write it myself, so this became the biggest part of the work, and the part where I learned the most. A linear layer is y = x @ W^T: x is a few rows of activations, W is the weight matrix (for the FFN up projection that is 2560 rows of 960 numbers), and the weights are stored as F16, half precision, so each one is 2 bytes.
The thing to understand about LLM inference is that generating one token is memory bound. The GPU has to read all ~0.7 GB of weights from memory for every single token, and does very little arithmetic per byte it reads. So decode speed is mostly “how fast can I stream the weights”, which on this chip is on the order of 150 GB/s. Prefill, where you push the whole prompt through at once, is the opposite: lots of rows, so it is arithmetic bound. A good matmul has to be good at both, and they want different kernels.
I ended up with three.
linear_small is for 1 to 4 rows (decode). One simdgroup owns one output number. Its 32 lanes walk along that weight row together, each lane loading 4 halves at a time, and simd_sum adds the 32 partial sums:
// (simplified)
device const half4 *wrow = (device const half4 *)(w + (ulong)n * in_f);
for (uint i = lane; i < in_f / 4; i += 32) {
    float4 wv = float4(wrow[i]);
    for (uint r = 0; r < nr; ++r) {
        acc[r] += dot(wv, x_row_r[i]);
    }
}
// then: acc[r] = simd_sum(acc[r])
At one row this runs at 100 to 190 GB/s in isolation, which is about the memory bandwidth of the chip (small matrices get more than the DRAM speed because they fit in cache). For one row it is as good as I’m going to get. But it falls apart with more rows, because every simdgroup re-reads all the activations. It tops out at around 400 GFLOP/s, while the tiled kernel below reaches 2.5 to 3 TFLOP/s on the same chip.
linear_gemm is for big batches (prefill). A tiled matrix multiply: each threadgroup computes a 32 by 64 tile of the output. It copies a slice of x and a slice of W into threadgroup memory, then multiplies them using Apple’s simdgroup_matrix type, which maps onto the GPU’s hardware for multiplying 8 by 8 blocks. Prefill went from about 1800 to about 2500 tokens per second when I rewrote it to load 16 bytes per thread at a time instead of 2, and to pad the rows of the threadgroup tiles so the 8 by 8 loads don’t all hit the same memory bank. I changed both at once, so I can’t tell you which one did more.
linear_mma_small is for 5 to 16 rows, and I only wrote it because of a profile. After the first full benchmark, going from batch 4 to batch 8 made a decode step jump from 12.6 ms to 31 ms. That is the point where linear_small hands over to the GEMM. I didn’t want to guess, so I added a profiler (RVLLM_METAL_PROFILE=1) that runs every dispatch in its own command buffer and adds up the GPU time per kernel. The result was a surprise:
linear_gemm_32x64 rows=8  960x320    1920 calls   70.0 us/call
linear_gemm_32x64 rows=8  960x960    1920 calls   77.7 us/call
linear_gemm_32x64 rows=8  2560x960    960 calls  193.1 us/call
A 960 by 320 matrix is 600 KB. Reading it at memory speed should take around 5 to 10 microseconds, and it took 70. The reason is that a 32 by 64 tile over 320 output columns means only 5 threadgroups, so half of the GPU does nothing, and each of those 5 walks through the whole inner dimension one slice at a time, with a barrier per slice. The kernel was latency bound, not bandwidth bound.
The fix is to split the inner dimension across the 4 simdgroups of a threadgroup, so that all of them work on the same 8 by 8 output tile, each on a different quarter of the reduction. They load their weight fragments straight from memory without any threadgroup staging or barriers in the loop, and add their four partial results at the end:
// (simplified)
for (uint k = sg * 8; k < in_f; k += 32) {     // each simdgroup takes every 4th slice of 8
    simdgroup_half8x8 b;
    simdgroup_load(b, w + n0 * in_f + k, in_f, ulong2(0, 0), true);   // weights, transposed
    // ... load the 8x8 piece of x, then:
    simdgroup_multiply_accumulate(acc[t], a, b, acc[t]);
}
The same job (960 by 320, 8 rows) went from 46 microseconds to 10.6 in a microbenchmark, and the decode step at batch 8 went from 31 ms to 17 ms.
decode ms/step      batch 1   batch 4   batch 8   batch 16   batch 32
first version         10.8      12.6      33.9      39.2       48.9
tuned GEMM             9.9      12.6      31.3      32.2       40.3
+ K-split kernel      10.0      13.1      17.6      22.7       41.7
Take the microbenchmark numbers with a grain of salt: it calls the same weight matrix 200 times in a row, so it is probably sitting in the chip’s cache, and a real model never reads the same weights twice in a row. I used it to compare kernels with each other, not to claim bandwidth. The full model benchmark above is the one that counts.
One more thing I found while doing this: my first attempt at a bigger 64 by 64 tile was ten times slower than the 32 by 64 one. The GPU was keeping its 16 accumulator matrices in registers only if the compiler fully unrolled the loops that index them. Mine didn’t, so the accumulators spilled to memory. Adding #pragma unroll fixed it, and then it was no faster than the smaller tile, so I deleted it. That is a very GPU kind of bug: the code is correct, it is just 10 times slower for a reason you can’t see in the source.
Things that were problematic
Fast math breaks -inf. By default the Metal compiler is allowed to assume that no value is ever infinity or NaN, because that lets it optimize more. My attention mask is made of minus infinity (masked positions get -inf added to their score, so that exp(-inf) is exactly 0 after softmax), and my argmax is defined in terms of NaN handling. I turned fast math off. Same lesson as the INFINITY problem in the CUDA post, a different compiler.
Memory leaks you can’t see. Metal returns command buffers and encoders as “autoreleased” objects, a macOS thing which only gets cleaned up when an autorelease pool drains. The main thread of a Mac app has one. A Rust worker thread doesn’t, so every forward pass would leak its command buffer, and the command buffer keeps all the workspace buffers alive. Nothing fails, memory just grows. The fix is to wrap each forward pass in autoreleasepool(|| ...).
An unfinished encoder is a crash. If a panic unwinds while a command encoder is open, Metal aborts the whole process with “Command encoder released without endEncoding”, and the real panic message never gets printed. I added a Drop that closes it, so test failures show their real cause.
Threadgroup arrays can only live in the kernel itself. I tried to declare the scratch arrays inside a helper function shared between two tile sizes and the compiler said “variables in the threadgroup address space cannot be declared in a non-qualified function”. They are declared in the kernel entry point and passed down as pointers. The two tiles and the output staging area also share one array, because separate ones went over the 32 KB threadgroup memory limit.
My tests were quietly skipping. This is the one I’m least proud of. The test helper that creates the GPU runtime returned None on any error, and tests did let Some(rt) = runtime() else { return }; so that they pass on machines without a GPU (the same pattern as the CUDA tests). When I changed the matmul and the new kernel failed to compile, the helper returned None, every GPU test returned early, and cargo test reported “12 passed”. I only noticed when the matmul microbenchmark printed “skipping Metal test: Metal kernel compile failed” instead of numbers. Now the helper skips only when the machine has no Metal device at all, and a kernel that doesn’t compile is a hard failure. I also made the shape sweep force every matmul kernel on every shape, instead of testing only the kernel the heuristic would pick.
How I know it’s correct
Same idea as for CUDA, with one big upgrade: on a Mac the GPU tests actually run, locally, every time. There are tests for each kernel against a plain CPU computation (matmuls over awkward shapes like 7 or 33 or 130 columns, which hit every tile edge case; RMSNorm and softmax on rows longer than the threadgroup; argmax with ties and NaN; attention with a head size that isn’t a multiple of 4). Then there are end to end tests that run the same tiny fake model through the Candle path and the Metal path, with prefill, batched decode, and each of the model features, and compare the logits. I ported the CUDA tests nearly unchanged. With these, the repo goes from 167 to 179 passing tests, and the 167 old ones are untouched without the feature.
Then there is the real model. The benchmark prints a checksum of every generated token, so I can compare the CPU and Metal runs directly:
batch   CPU checksum       Metal checksum
1       f40f6d436028b4ea   f40f6d436028b4ea
4       22a7d9f599e45eef   22a7d9f599e45eef
8       bbecff1e495ba3f8   bbecff1e495ba3f8
16      bd4d252fd3242b9b   bd4d252fd3242b9b
32      942d87ce564714d8   c940aff73fbb1d8f   <- differs
Four out of five are identical over nearly two thousand generated tokens. At batch 32 the checksums differ, and I wasn’t going to ignore it. I reran batch 32 on its own with the tokens dumped (it draws different random prompts than the sweep, so its checksum is different, but the setup is the same): exactly one sequence out of 32 differed, at its very first generated token. So I replayed that random prompt through both paths and compared the logits: the CPU’s best and second best candidate differ by 0.0016, while the F16 weights on the GPU shift logits by about 0.01. That is a coin flip between two nearly equal tokens, and F16 rounding decided it the other way. (The prompts in the benchmark are random token ids, so the model is more often undecided than on real text.) Not a bug, but it was worth proving rather than assuming. The check is now a test you can run on any model: it compares logits on real weights and fails if the argmax flips when the CPU had a clear winner.
Numbers
Machine: MacBook with an M5 (10 CPU cores, 10 GPU cores), 24 GB of memory. Same SmolLM2-360M Q8_0 file as the earlier posts, a 128 token prompt, 64 generated tokens, greedy decoding, same bench binary and the same flags for both devices. Each number is the average of 2 CPU runs and 3 Metal runs, each run is a discarded warmup plus the measured pass. Metal was very steady, decode times varied by about 2 percent between runs:
         ---------- CPU ----------      --------- Metal ----------
batch    tok/s   ms/step   1st token    tok/s   ms/step   1st token    speedup
1         24.5     36.2     341 ms       91.3     10.3      51 ms        3.7x
4         40.4     78.2     357 ms      251.7     13.0      50 ms        6.2x
8         54.8    101.5     369 ms      347.0     17.0      51 ms        6.3x
16        70.8    136.5     367 ms      459.6     22.5      51 ms        6.5x
32        83.9    200.3     352 ms      472.8     41.6      51 ms        5.6x
(tok/s is total throughput over all requests, ms/step is one decode step, “1st token” is time to first token.)
Prefill, the speed at which the prompt is processed, is about 350 tokens per second on the CPU and about 2500 on Metal, 7 times faster, which is where the 340 ms to 51 ms first token time comes from. For batch 1, which is one person chatting with a model, generation goes from 24 tokens per second to 91.
A few things I notice:
- Batching pays more on the GPU. Going from 1 to 16 requests makes a Metal step only 2.2 times slower (10.3 to 22.5 ms) for 16 times the work. On the CPU the same change makes a step 3.8 times slower.
- The speedup at batch 1 is the smallest, 3.7x, because a single token only needs ~0.7 GB of weights to be streamed once and the CPU is already decent at that. The more rows there are, the more the GPU’s arithmetic matters.
- Batch 32 stops scaling (460 to 473 tok/s from batch 16). Above 16 rows the model switches to the tiled GEMM, which does 32 rows of work at a cost I haven’t brought down yet. See the next section.
- Memory is about the same (2.5 to 2.8 GB peak either way) because the F32 copy of the model stays in RAM next to the F16 copy on the GPU side. Apple’s shared memory means that is the same physical RAM, but I’m holding both.
For scale, 10 ms for a batch 1 step, with ~0.7 GB of weights, is about 70 GB/s of effective weight streaming. The chip can do roughly twice that, so there is still a factor of 2 on the table at batch 1. I haven’t compared against llama.cpp on the same file yet, so I still can’t tell you where this stands against a well tuned engine.
What’s basic about it
Honest list again. This works and it is much faster than the CPU path, but it leaves a lot on the table:
- About 900 tiny dispatches per token. Each one runs after the previous one finishes, and on a small matrix the GPU spends as much time waiting between kernels as working. Metal can run independent dispatches concurrently (Q, K and V projections, or gate and up, don’t depend on each other), and fusing the little kernels together (the transposes, RoPE, the residual adds) would cut the count a lot. At batch 1 the profile says the transposes alone are 5 percent of the GPU time.
- Attention is five separate kernels (gather, scores, mask, softmax, apply), and the gather copies every sequence’s whole K and V context out of the paged cache on every step. A single fused kernel that reads straight from the blocks would remove that. In the batch 32 profile these kernels are about a fifth of the total GPU time.
- Weights are F16, not Q8_0. The GGUF file is Q8_0, which is 1 byte per weight, so the GPU still streams twice what it could. Since decode is memory bound, a Q8_0 matvec kernel should be the single biggest win for decode speed, and it would also let me drop the F32 copy of the model.
- The batch 5 to 16 and batch 32 matmuls are only as good as I got them in an afternoon. The tiled GEMM reaches about 2.5 to 3 TFLOP/s on large inputs, and the chip has more than that. I also haven’t tried Metal 4’s tensor operations, which the M5’s GPU is built to accelerate.
- Host work every step. The RoPE tables, the mask and the gather plan are rebuilt on the CPU and uploaded on every forward pass, and a few dozen buffers are allocated per step. I fixed the same things on CUDA already; I just haven’t done it here.
- The KV cache is F32.
What’s next
- Concurrent dispatch and kernel fusion, the cheapest way to get the batch 1 step closer to the bandwidth limit.
- A fused paged attention kernel, so the context isn’t copied on every step.
- Q8_0 weights on the GPU for both backends. It halves the bytes streamed per token compared to F16, and the F32 to F16 change on the T4 (also half the bytes) was worth 1.5 to 2 times, so I expect a real jump.
- Compare against llama.cpp on this machine, finally, with the same GGUF.
The code is at github.com/ermolushka/rvllm. Everything Metal is under src/metal/, and the kernels are in src/metal/kernels/. Building and running it is:
cargo build --release --features metal
cargo run --release --features metal -- cli --model SmolLM2-360M.Q8_0.gguf --prompt "The capital of France is" --metal
Two env vars help when you poke at it: RVLLM_TIMING=1 shows how a decode step splits between the CPU encoding the work and the GPU running it, and RVLLM_METAL_PROFILE=1 prints the GPU time per kernel, which is how I found the matmul problem above.
Earlier posts on rvllm: rvllm - A Small LLM Inference Engine in Rust for the engine itself, Optimization of the Rust LLM engine for the CPU profiling and fixes, and Adding CUDA to my Rust LLM engine for the NVIDIA version.